
P.1 Interpret pictographs
P.2 Create pictographs
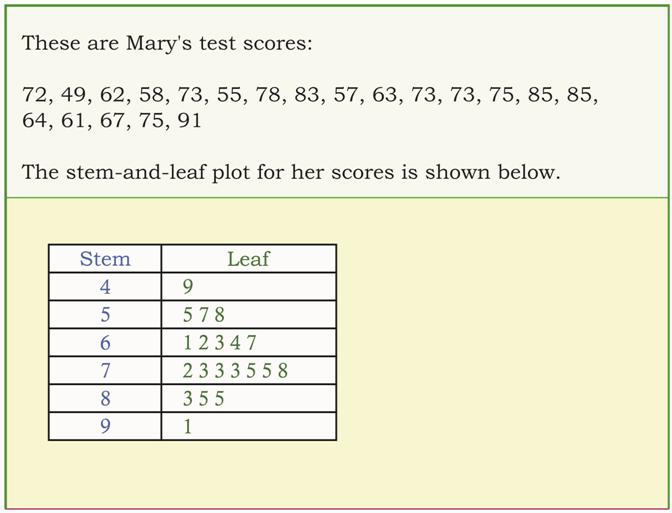
P.3 Stem and Leaf plots
P.4 Interpret line plots
P.5 Create line plots
Post your completion date. Tell me one thing you learned.
Part Two
P.8 Create bar graphs
P.9 Interpret double bar graphs
P10 Create double bar graphs
P11 Create histograms
P.12 Circle graphs with fractions
I finished 2014.12.18., and I learned that how to create line plots, since I haven't done it before.
ReplyDeleteI finished on December 18th, 2014, and I learned what line plots are. (If we're not supposed to post, then I'm just keeping it here for a reminder over the holidays)
ReplyDeleteMrs. O'Hara, can you fix the P numbers? P.8 is Interpret bar graphs, not create bar graphs. P.9 is create bar graphs, and so on so forth.
ReplyDelete