
P.1 Interpret pictographs
P.2 Create pictographs
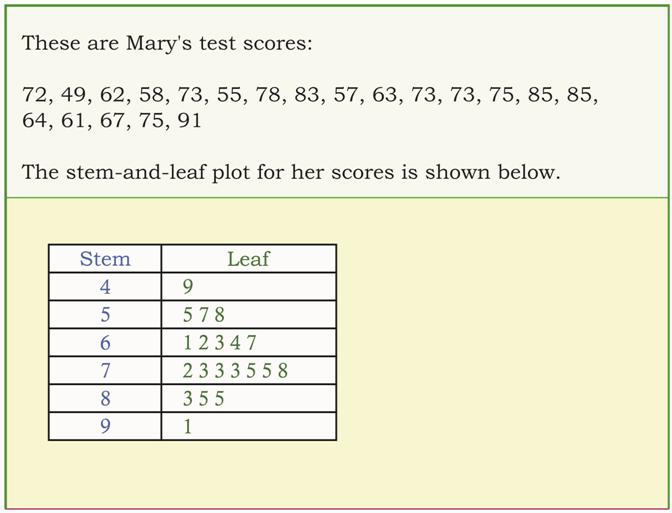
P.3 Stem and Leaf plots
P.4 Interpret line plots
P.5 Create line plots
Post your completion date. Tell me one thing you learned.
Part Two
P.8 Create bar graphs
P.9 Interpret double bar graphs
P10 Create double bar graphs
P11 Create histograms
P.12 Circle graphs with fractions
