Tuesday, January 29, 2013

Total Surface Area (TSA) of a Rectangular Prism


Watch the above video. Answer the following questions in your math workbook (remember to include a title). 1. Write a formula for figuring out the total surface area of a rectangular prism. How would your formula change if you were figuring out the total surface area of a cube?
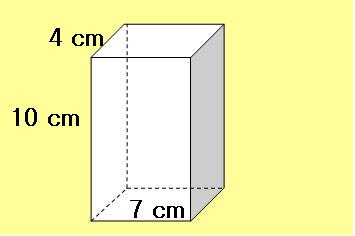
2. Draw and measure the total surface area of the following shape.Record your formula and answer clearly.

Sunday, January 27, 2013

IXL Math Practice/Review

http://ca.ixl.com/
Explore the above math site.  See me for your own name & password.  Begin with charts and circle graphs. 

Thursday, January 24, 2013

Graphing/Data Management

http://nces.ed.gov/nceskids/createagraph/
Read the create a graph tutorial.  Afterwards, create one of each graph.

Re: Visual Multiplication and 48/2(9+3)

  
Watch the above video. Try a couple of examples. What is your opinion of these methods?

Tuesday, January 22, 2013

Math Assignment - due Thurs. Jan 24th (in-class)

We will be taking up #26 in class on Wednesday.  Using the EQAO guide level your answer to number 26.  Explain why you gave yourself a specific level. 

Wednesday, January 16, 2013

A Better Way to Divide: Short Division - Review


Watch the above video clip.  What is the difference between this short division and the way you have been doing short division in class? Do you like short division or long division better? Explain why. (Post your answers.)

Sunday, January 13, 2013

Interactive Question = Skyscrapers/Brock Caribou Math Contest this Wednesday

http://www.brocku.ca/caribou/games/game_menu.php
Practice, practice, practice.
What strategies are you using? Post your answers.
http://www.brocku.ca/caribou/practice_test_login.php
Brock Caribou Practice Tests.  You may use pencil, paper, charts etc., but no calculators.
Check the answers carefully.

Saturday, January 5, 2013

Math - POW - due Friday, January 11th


1.  What is the name of this type of graph? What is the average (mean) score on the science test?  What is the median and mode?  What is the range of data between the lowest score and the highest score?  List 3 types of data that would be appropriate to track on a this kind of graph.

2. Look for graphs in the newspaper (online or real).  Find three different & interesting graphs and bring them in to share.
Be ready to explain:
a. Type of graph
b. Why this specific graph was chosen to display the data
c. Other types of graphs which you think may display the data just as well/types of graphs that would not display the data well

3.  Create a set of data with a mean of 6 and a mode of 4.